Do You Have Big, Fast, Useless, or Ugly Data? Here’s What to Do.
Teresa Wingfield
January 5, 2023

It has been more than 20 years since Meta Group (acquired by Gartner) introduced the 3Vs of data, Volume, Velocity and Variety. Gartner later expanded the 3Vs to 5Vs by adding Value and Veracity. To this day, these remain important considerations in data analytics. However, their size and complexity continue to increase. Here’s a look at where we are today and some pointers for how to keep up.

Volume
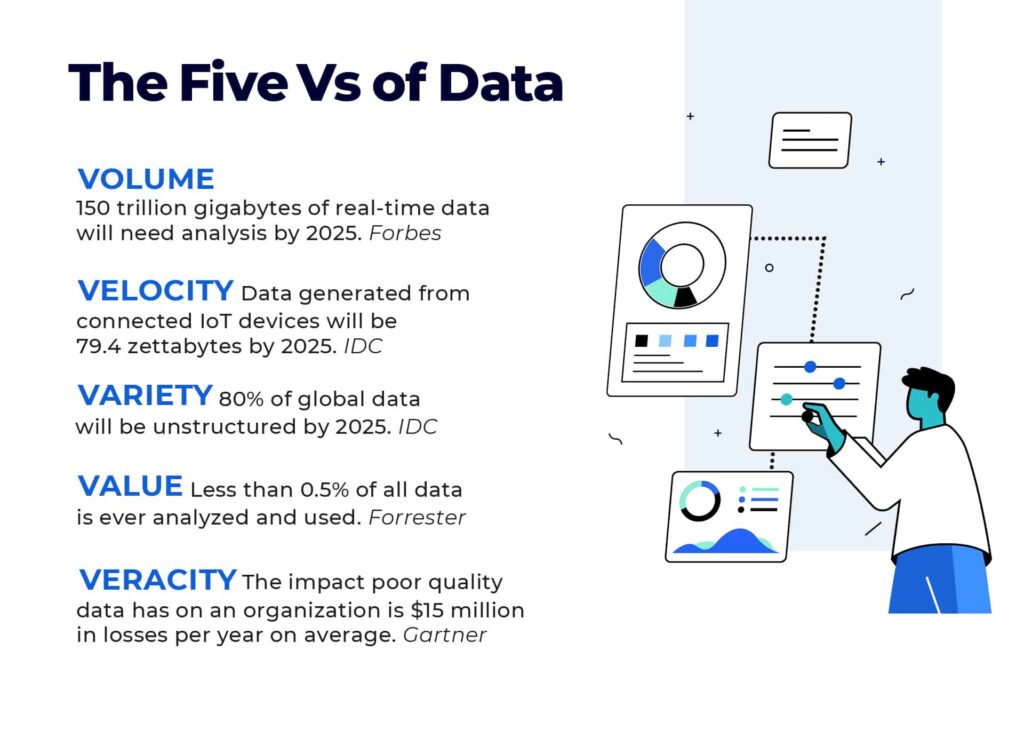
The volume of data refers to the size of data that needs to be analyzed and processed. Data is getting bigger. IDC predicts that the global data volume will expand to 175 zettabytes by 2025. Over half of this, 90 zettabytes, will come from Internet of Things (IoT) devices. Moreover, Forbes predicts that 150 trillion gigabytes of real-time data will need analysis by 2025.
Pointers:
- Look for solutions that can scale with data volumes.
- Make sure that you can reuse data pipelines and share data across use cases.
- Choose real-time analytics that can meet your key performance indicators and service level agreements.
- Evaluate the solution’s ability to offer consistent management, governance, and compliance.
Velocity
Velocity refers to the speed with which data is generated. Data is getting faster, especially with the increased analysis of real-time data streams to tackle diverse use cases such as IoT sensor data analytics, fraud detection, online advertising, cybersecurity, log analytics, stock trading and much more. IDC estimates data generated from connected IoT devices will be 79.4 zettabytes by 2025, growing from 13.6 ZB in 2019.
Pointers:
- Preprocess data at the edge to reduce the cost and effort of moving and storing data.
- Test high speed data load capabilities of your data analytics so you can quickly access operational and streamed data.
Variety
Variety refers to the number of types of data and includes structured, semi-structured or unstructured data. Data required for analytics is getting more jumbled. Unstructured data, content that does not conform to a specific, pre-defined data model, is rapidly surging. IDC forecasts that 80% of global data will be unstructured by 2025. About 90% of unstructured data has been created in the last two years. Organizations analyze just .5% of unstructured data today, but this will certainly increase soon. Semi-structured data such as JSON, XML, and HTML formats is also dramatically growing due to growth of the web.
Pointers:
- Assess the solution’s ability to make data accessible regardless of structure or format.
- Look for the flexibility to create custom connectors and extend integrations.
Value
Value refers to whether data is positively impacting a company’s business outcomes. Unfortunately, data is often useless. The reason is simple; data doesn’t meet the needs of users. Forrester finds that less than 0.5% of all data is ever analyzed and used. It also estimates that if the typical Fortune 1000 business was able to increase data accessibility by 10%, it would generate more than $65 million in additional net income.
Pointers:
- Get to know what data your users really need.
- Prioritize data that will help users meet their goals.
- Understand issues that may prevent users from getting insights they need.
- Present data in a manner that is timely and in the right context.
Veracity
Veracity refers to the quality and credibility of data. Data can be ugly and decisions made on it cost you money. According to Gartner, the financial impact poor quality data has on an organization is around $15 million in losses per year on average.
Pointers:
- Ensure your data quality is adaptable and scalable.
- Include a level of automation that can help filter out quality data and better integrate it across the enterprise.
- Take a collaborative approach to data quality across the enterprise to increase knowledge sharing and transparency regarding how data is stored and used.
Additional Resources:
Subscribe to the Actian Blog
Subscribe to Actian’s blog to get data insights delivered right to you.
- Stay in the know – Get the latest in data analytics pushed directly to your inbox.
- Never miss a post – You’ll receive automatic email updates to let you know when new posts are live.
- It’s all up to you – Change your delivery preferences to suit your needs.
Subscribe
Subscribe to the Actian Blog
Subscribe to Actian’s blog to get data insights delivered right to you.
- Stay in the know – Get the latest in data analytics pushed directly to your inbox
- Never miss a post – You’ll receive automatic email updates to let you know when new posts are live
- It’s all up to you – Change your delivery preferences to suit your needs